Stan is
uncomfortable with Jan’s view of data and tables.
Stan: So you visited 30 museums in ten days?
Jan: For the purpose of finding out how
technology encourages a more engaging and interactive experience for the
visitor.
Stan: And you want to list the technological
devices in a table. How many devices?
Jan: Eight or ten. Cameras, projectors, iPads,
viewers, simulators, interactive booths, studios…
Stan: So you run technology down Column 1, and
add the number of devices down Column 2.
 Jan: Need more columns for other data. Like
simulators could be flight simulators or code-making simulators. Need a column
for photographs too.
Jan: Need more columns for other data. Like
simulators could be flight simulators or code-making simulators. Need a column
for photographs too.
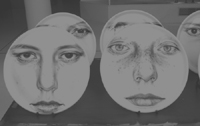
Stan: Photographs? In a table?
Jan: Sure. Visuals are data too.
Stan: Huh. Next we’ll be seeing video clips in
tables.
___________
Voice-over
Statisticians see data as numerical and
linguists take words as data. Their tables are traditionally filled with
alphanumeric data. Artists regard visual images as data, so it seems legitimate
to include photographs in tables.
...
...


No comments:
Post a Comment